How I Pinpointed the Performance Bottleneck
![]()
This article is a small write-up regarding how I pinpointed the performance bottlenecks in my code during the making of Loomnatic.
Update 2022-08-19: add instructions for OpenProcessing
Why find performance bottlenecks?
Loomnatic is a computational-heavy project. There were quite a few performance issues during the development process due to bad algorithms. The execution time before my performance improvement is often 10+ times than after the fix. Such differences could sum up to a difference between 1+ min to 5 sec, which results in very different experiences from the viewers’ perspective.
Performance improvement is also crucial to me because it speeds up my development. I get faster feedback on my code changes, and generating hundreds of test outputs takes significantly less time.
TimeTracker
I made a TimeTracker helper to measure the execution time of specific code blocks.
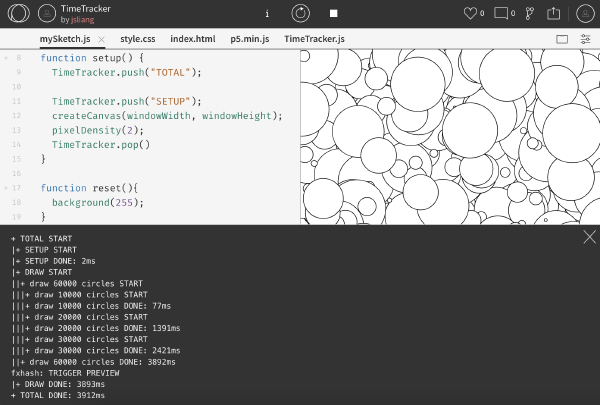
Here’s an OpenProcessing sketch I made to give you an idea of how it works: TimeTracker by jsliang. When you open this link and wait for several seconds, you should see the rendered sketch and a console output at the bottom, as shown in the image:

To identify performance bottlenecks, I manually insert a pair of time tracker function calls that record the timestamp before and after the code block I want to measure. The timestamp difference between the pair is the total execution time for the wrapped code block.
Here’s the code snippet of my TimeTracker function:
function initTimeTracker() {
  const stack = [];

  function getPadding() {
    return `${Array.from({ length: stack.length - 1 })
      .map(() => "|")
      .join("")}+`;
  }

  // Push the current timestamp to stack
  function push(label) {
    stack.push({ label, timestamp: +new Date() });
    console.log(`${getPadding()} ${label} START`);
  }

  // Pop the previous timestamp from stack and calculate
  // the difference between the current timestamp
  function pop() {
    const padding = getPadding();
    const prev = stack.pop();
    if (!prev) {
      console.error(`Stack is empty. Did you forget to call push() first?`);
      return;
    }
    const currTimestamp = +new Date();
    const diff = currTimestamp - prev.timestamp;
    console.log(`${padding} ${prev.label} DONE: ${diff}ms`);
  }

  return { push, pop };
}

window.TimeTracker = initTimeTracker();
If you’re a TypeScript lover like me, you can download the TypeScript version from this Gist: TimeTracker · GitHub
To use my time tracker function, paste the above code snippet somewhere in your code.
If you develop with OpenProcessing, you can paste the above code snippet into a new file named TimeTracker.js, then import it before your sketch in index.html:
<script src="./p5.min.js"></script>
<!-- import TimeTracker.js before mySketch.js -->
<script src="./TimeTracker.js"></script>
<script src="./mySketch.js"></script>
(If you’re unsure whether you’re doing this correctly or not, you can refer to the source code of my TimeTracker project on OpenProcessing.)
The code snippet initializes a TimeTracker object with which I can call TimeTracker.push("code block name") and TimeTracker.pop() before and after every code block that I want to measure:
TimeTracker.push("draw 60000 circles");
drawCircles(10000);
drawCircles(20000);
drawCircles(30000);
TimeTracker.pop();
And the console output gives me a report like this:
+ TOTAL START
|+ SETUP START
|+ SETUP DONE: 1ms
|+ DRAW START
||+ draw 60000 circles START
|||+ draw 10000 circles START
|||+ draw 10000 circles DONE: 44ms
|||+ draw 20000 circles START
|||+ draw 20000 circles DONE: 1794ms
|||+ draw 30000 circles START
|||+ draw 30000 circles DONE: 3491ms
||+ draw 60000 circles DONE: 5329ms
|+ DRAW DONE: 5329ms
+ TOTAL DONE: 5366ms
Note that the report shows the total execution time of both parent and child functions. This nested information is extremely helpful since I usually do not know which part of my code is the most critical to the performance issues. With the nested representation, I can quickly see where I should try to improve first.
Besides those instrumentations, I wrap the whole code with TimeTracker.push("TOTAL") which gives me the total execution time. We will use this information in the next section.
Collecting the execution time of numerous outputs
Another challenge I faced while developing Loomnatic was that only a minority of the variations hit the performance bottleneck. How do I identify such bad-performance variations quickly?
I’ve been using Laurent Houdard’s fxsnapshot to generate hundreds of outputs and test the variations for several projects. I figured I could fork this repository and edit the tool to have it print out the total execution time for me.
In my edited version, I added this piece of code under the console event handler in fxsnapshot.js (source):
const totalTime = text.match(/TOTAL DONE: (\d+ms)/);
if (totalTime) {
  timeSpent = totalTime[1];
}
This code captures the TOTAL DONE: 10460ms console output printed by the TimeTracker object and stores the numeric part in the timeSpent variable. With that, I can append the time spent information to the original output:
console.log(`${f} ${timeSpent}`);
If you develop with OpenProcessing, you also need to replace the URL in this line const url = 'http://localhost:8080' with the preview URL of your sketch (source):
const SKETCH_ID = 1628294; // OpenProcessing sketch ID
const url = `https://preview.openprocessing.org/sketch/${SKETCH_ID}/preview/false/index.html`;
Now I can see the execution time of each output while using the fxsnapshot tool:
fxsnapshot $ node fxsnapshot.js 256
images/0001-oo3dhGsAhPMjAEaoA44c9xwJtwadgyD859CATsdC2BQH7eXmaWe.png 7274ms
images/0002-ooTHvK2koEh8aPgxim6dyr197LcpmkbjxayoGT7ru7NwcbiabE1.png 3770ms
images/0003-ooRWFQEu6rmYpbvnqWSzDTpbd8zxt5rN2wGGUjpRak2bEkrW9gf.png 2839ms
images/0004-ooHRxtNrLktmVWQ1uYhZjQhLjqyQpdPp1uHCwKHXZScyM5QqKna.png 2696ms
images/0005-oo31G5WoYtHNpJc85m3LJ338ijQNBH18GEoH6u9Rj1E7gUtpwas.png 3177ms
images/0006-ooEcZhJfayzW3FZroNEmVVRPp2rHUXXNFq6GorDnwiGpHa5XA21.png 5529ms
images/0007-ooow9qFrDfVpXzkDLwyW5pAPvoLPjcPcJRfkDEN1dDjuyqaUp1j.png 3700ms
images/0008-ootEes3rrYm1sSpoRagXNr1JWy1k9imyumPPx3EjTC49bdkoAzg.png 5050ms
images/0009-ooftZwcXYqG7upCKbb5C8PYZqcEMNgRgiwLW6yUMVf9ukjwLLh7.png 16687ms
images/0010-oofmTwwqPYzAJJBa5KRE4fJAtznCx2q8dmtxUmRqxQqxi4zGSPG.png 3336ms
images/0011-ooxJv5zbrH1nXxeAFRhnkmPehZd2VoHGh8woT1SkkmzkuWp34pB.png 3810ms
images/0012-ooVaMFEQGTYrBDZH2BBhVFUzdY8ywFc9DFwEm8vsUeWfZukWQiW.png 8151ms
...
From the output above, I observe that output No. 9 is the outlier. It took nearly 17 seconds for No. 9 to complete the rendering, while for other outputs it took fewer than 8 seconds. I can then focus on this variation and figure out its performance bottlenecks with the steps mentioned in the previous section.
Conclusion
This article explains how I measure the execution time of different parts of my code and how I tweaked Laurent Houdard’s fxsnapshot tool to help me quickly find out the execution time of various outputs. I hope this gives you some ideas.
If you find this helpful or have better methods to share, you can leave a comment under this Tweet. I will be delighted to hear from you. :)